MiCharts
Reporting & Analytics
USDA reimbursement reports, participation trends, financial summaries, and natural-language query interface. Board-ready reports in one click.
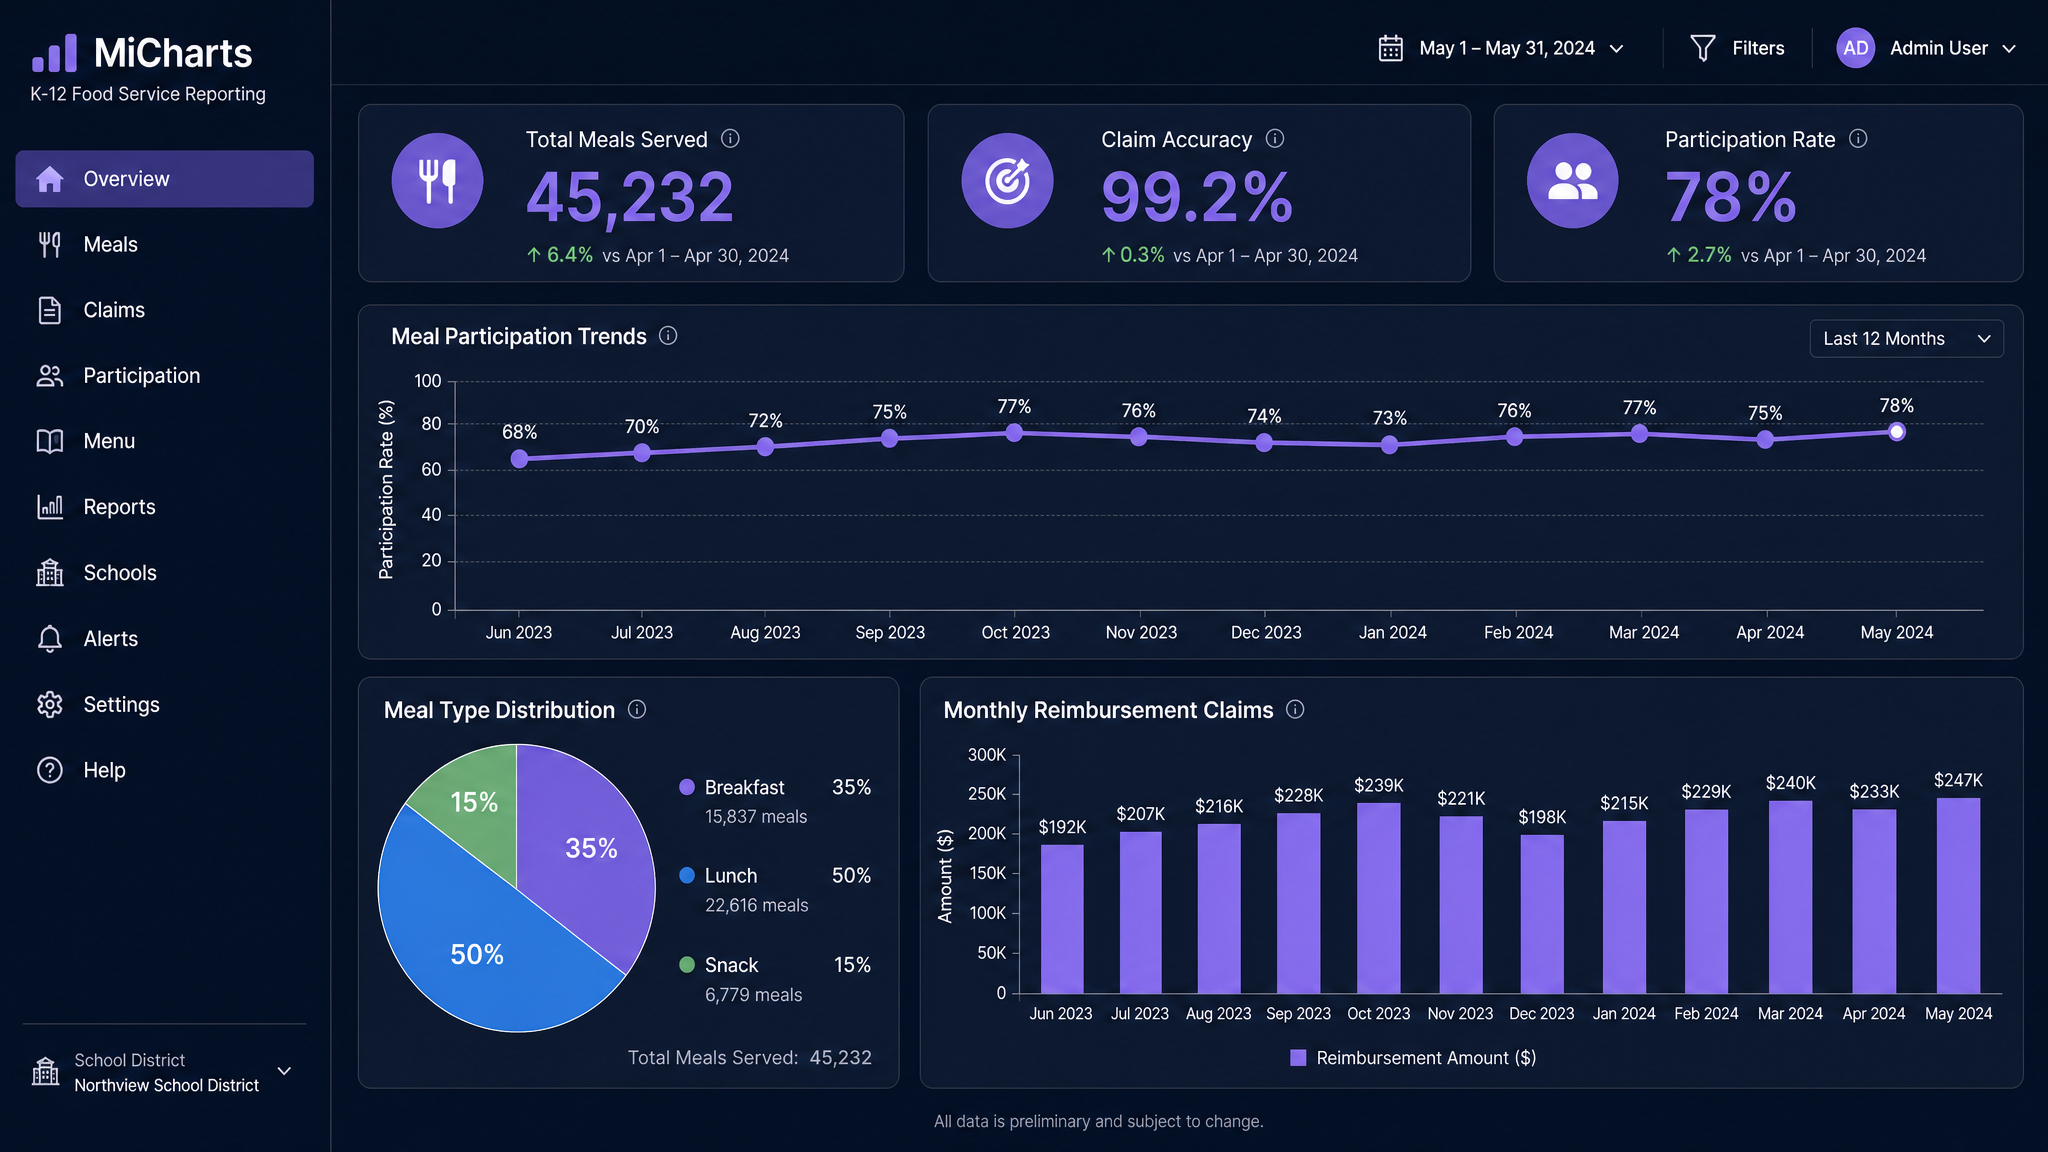
MiCharts Analytics Dashboard — UI mockup
Getting Started
From raw data to board-ready reports in 5 steps.
Data Flows In Automatically
MiCharts pulls data from MiMeals (transactions), MiTasks (inventory), MiTimes (labor), and MiComs (claims). No manual uploads.
Choose Your Dashboard
Pre-built dashboards for Participation, Financial, Claims, Labor, and Inventory. Or build your own.
Set Date Ranges
Filter by day, week, month, school year, or custom range. Compare this year to last year.
Ask in Plain English
Type "Show me participation by campus for October" and MiCharts generates the chart. No report builder needed.
Export & Share
Export any report as PDF, CSV, or send directly to your superintendent. Board-ready in one click.
Key Features
The reports your superintendent actually wants to see.
USDA Reimbursement Reports
Meal counts by type, edit checks, and claim summaries — all formatted for federal submission.
Participation Trends
See which campuses are growing, which are declining, and which meal periods need marketing.
Financial Summaries
Revenue, cost per meal, food cost percentage, labor cost allocation — all in one view.
Natural Language Queries
Ask questions in plain English. MiCharts + miAgentic generates the answer with visualizations.
Year-over-Year Comparison
Compare any metric across school years. Track improvement and justify budget requests.
Scheduled Reports
Set up weekly or monthly reports that email automatically to your distribution list.